
– Metabolism biomarker testing dominates companion diagnostic (CDx) use
– There is significant variability in reimbursement trends from state-to-state for CDx biomarkers
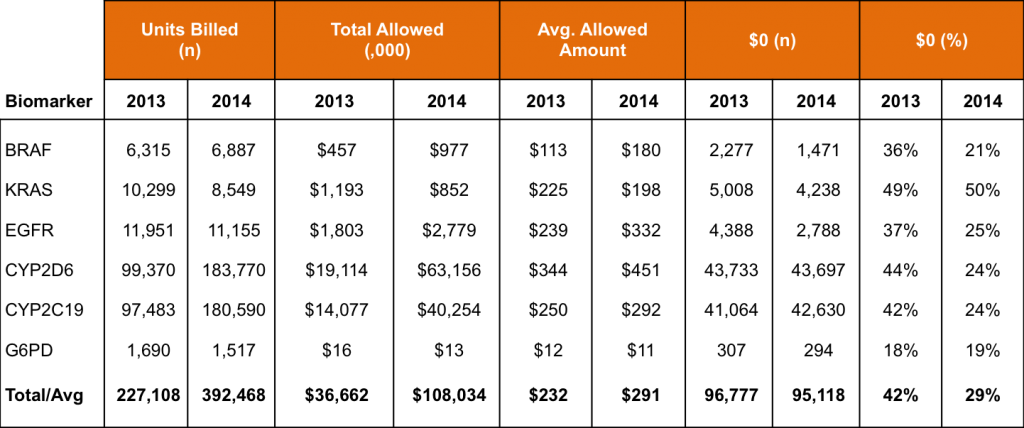
– Rejected claims for CDx biomarker testing dropped by almost a third from 2013 to 2014
We have just completed an analysis of data from the Centers for Medicare & Medicaid Services (CMS) covering reimbursement for tests that measure six different companion diagnostic biomarkers, and the volume of tests ordered for these biomarkers increased by 73% from 2013 to 2014.
The total reimbursement amount for these biomarker-based tests jumped even more dramatically, from $37 million in 2013 to $108 million in 2014, an increase of almost 200%.
The amount spent outpaced the increase in test volume due to two factors: a 25% increase in the average amount reimbursed per test, and a 31% decrease in the number of tests that were billed to CMS but rejected (i.e. reimbursed at $0).
In all, 29% of biomarker tests billed to CMS during 2014 were rejected, compared to 42% in 2013.
Data Overview
This analysis uses CMS data for California (the most populous state) and ten other Western states (those in CMS Regions 8, 9, and 10), which combined account for 21% of the U.S. population. The CMS data were acquired through a Freedom of Information Act (FOIA) request made by us, Amplion, and include the allowed amounts and total units billed for each CPT code, by state, for the years 2010 to 2014, inclusive.
The biomarkers selected for this analysis are the cancer biomarkers BRAF, KRAS, and EGFR, and the metabolism biomarkers CYP2D6, CYP2C19, and G6PD.
BRAF was selected because it is a companion diagnostic biomarker for three targeted therapeutics that are indicated for melanoma, and BRAF is only associated with this particular disease in a companion diagnostic context.
KRAS was also selected for its specificity, but in this case for two drugs that target colorectal cancer. While KRAS is not associated with any other diseases in a companion diagnostic context, it is measured along with EGFR for the two colorectal cancer drugs in question.
The specificity factor is important because it will allow for broader analysis of testing rates relative to disease incidences.
EGFR was selected because, along with the aforementioned associations with KRAS and colorectal cancer, it is also a companion diagnostic for three targeted drugs for lung cancer, and so represents a less specific but more broadly used cancer biomarker.
The other three biomarkers were chosen because they are associated with significantly the largest numbers of drugs of any companion diagnostic biomarkers. CYP2D6 is in the labels of 40 different drugs, G6PD is in 19, and CYP2C19 in 16. The next closest biomarkers (EGFR, HER2, and UGT1A1) are in the labels of just five different drugs each.
All six of the biomarkers selected were reimbursed under only one CPT code each during 2013 and 2014, and no other biomarkers were reimbursed under those same codes, allowing for discrete analysis of each biomarker.
Cancer Biomarker Testing Trends
Testing volume for the three cancer biomarkers was far lower than that for the three metabolism biomarkers, at just 7% of the total tests billed for the six biomarkers in this analysis. Testing volume for the three cancer biomarkers also declined across all states by 7% overall from 2013 to 2014. The one exception was BRAF, which increased in total test volume from 2013 to 2014.
It is interesting to note that testing volume trends were not consistent across states. For example, EGFR testing declined by 29% in California but increased by 126% in Arizona from 2013 to 2014. Arizona actually stands out as the one state in the analysis where testing volume increased year-to-year for all three biomarkers.
While test volume decreased overall, the average amount reimbursed increased by 23% for cancer biomarker tests. KRAS was the only biomarker of the three to decrease in average test amount, dropping from $225 to $198 per test.
State-to-state variability was less significant for average amount per test than it was for test volume, as all of the states tended to trend together.
Overall variability in the allowed amount for each test was very signifiant. For BRAF testing, 75% of the tests in 2014 were billed at $179, 21% were reimbursed at $0, and the remaining 4% were reimbursed at amounts ranging from $8 to $383.
For KRAS, 47% of 2014 tests were reimbursed for $197, 50% were reimbursed for $0(!), and the remaining 3% were reimbursed for amounts ranging from $58 to $385. CMS seems to hold a dim view of the value of KRAS testing, either that or a lot of KRAS tests were ordered inappropriately.
For EGFR, 70% of 2014 were reimbursed for $330, 25% were reimbursed for $0, and the remaining 5% for amounts ranging from $52 to $636.
Metabolism Biomarker Testing Trends
Testing volume for metabolism biomarkers increased by 84% from 2013 to 2014. Testing for CYP2D6 and CYP2C19 account for almost 100% of the metabolism biomarker test volume in this analysis, as G6PD is tested only very rarely.
While testing for 2D6 and 2C19 both grew by 85% from 2013 to 2014, 2D6 was tested over 50% more often than 2C19 in 2014. 2D6 also appreciated a much greater increase in average reimbursed amount per test than did 2C19, and in 2014 2D6 was reimbursed at the highest amount of any of the six biomarkers in this analysis.
At the state level, test volumes and reimbursement amounts tended to generally follow the overall growth trends from 2013 to 2014. Total testing volume by state, however, is much more variable for the metabolism biomarkers than for the cancer biomarkers.
Summary
Here we have compiled the overall testing trends for a select group of biomarkers that hopefully reflect broader trends in the use of companion diagnostic biomarkers.
In this analysis we haven’t tried to draw any causal conclusions, or to compare the testing volumes against disease incidences and drug prescription rates – those analyses are for future posts.