Continuing our series of interesting biomarkers to watch in various therapeutic areas we now present 10 biomarkers to watch in the Metabolic and Endocrinology (ME) therapeutic area (see previous posts for Oncology and Cardiovascular).
These biomarkers were selected using the same approach as for the prior lists, whereby the only bias applied to the list creation from the outset was the selection of a therapeutic area. This list was also generated using the same basic filtering criteria as for the prior lists, which I will now describe in the greatest detail to-date.
Step 1: Rough Filter
Beginning with a list of all of the biomarkers in BiomarkerBase in the ME therapeutic area, the first filter was to include only biomarkers for which there is not yet an FDA-cleared or approved test. Next was to include only biomarkers that are represented in more than one therapeutic area, under the assumption that these are lower risk, more highly validated biomarkers overall. The next filter was to include only biomarkers that were associated with a range of clinical study publications, with the high cutoff of the range filtering out more common biomarkers, and the low cutoff filtering out biomarkers with minimal validation.
Those filters yielded a lit of almost 50 candidate biomarkers, and so finer filters were required to distill it down to 10 (which I acknowledge is an arbitrary number, but is useful for a blog post). I should mention that the data informing the filters described to this point are already within BiomarkerBase. The more detailed data for the fine filters described next are all in the process of being added, as are the filtering and visualization tools that will take an analysis such as this out of Excel and into a browser.
Step 2: Fine Filter
The first fine filter was to gather the total number of clinical trials, by year, in which each of our candidate biomarkers has been or is being used. This would have been a great filter for Step 1, but is time-consuming data to gather, and so was only applied to the candidate biomarkers previously generated from Step 1. The process involves searching ClinicalTrials.gov for the most common names for each candidate biomarker, downloading the resulting lists, filtering out duplicate records, and sorting the trial counts by year in a pivot table. Until we release our advanced filtering tools and expanded trial coverage in BiomarkerBase (coming very soon, contact me for early access) there is simply no other way to get this very useful data into an analysis such as this.
Once we compiled these timelines of trial use for each candidate biomarker, going back 9 years for each (2005-2013, inclusive), we calculated the CAGR for each, and forecasted the number of new trials that would use each candidate biomarker per year by 2017. We then filtered out all of the biomarkers that had a 0% or lower growth rate, which trimmed our list down to 23 candidate biomarkers.
Step 3: Final Analysis
Since our goal was a list of 10, we needed to start considering other ways to further refine the list, and this required a bit of consideration of our goal. We wanted to create a list of “10 biomarkers to watch” in the ME therapeutic area, and so were wanting to include biomarkers that might be a bit off the radar for some people. With this goal in mind we then did bit more filtering based on publication history, to further weed out the more established biomarkers. Using this filter we dropped some clearly interesting biomarkers with high volume projections for future use (e.g. mTOR, HIF, Caspase 3), but which are already part of the understood clinical biomarker landscape for most people.
The final filtering was done on a biomarker-by-biomarker basis, looking at (along with the aforementioned growth rate and forecast for clinical trial use) the percent of all published literature for each that describes clinical studies. With a preference for more obscure biomarkers, we also dropped all of the interleukins from the list, despite the fact that some of the less common of these markers have interesting growth trajectories.
Limitations and Inefficiencies
There are many limitations to this list based on the methodology employed, and most of them have to do with the data sources utilized and the organizational/analytical tool used (Excel). Much of the data had to be gathered by searching CT.gov and Pubmed, exporting results, and importing them into Excel. The searches almost certainly missed trials and publications due to lack of normalized nomenclature, and were time-consuming to undertake and utilize. Filtering algorithms and forecasts had to be created in Excel, and a massive table created to organize everything. Presentation-worthy tables and charts had to be created in PowerPoint, bringing yet another application to the process.
In short, it was a slow, incomplete, and inefficient process, but still managed to yield a lot of interesting biomarkers that could be of interest to clinical trial planners and assay developers. With the data and analytical tools under development at BiomarkerBase, this process will be much faster and will rely on complete and constantly updated information, and will be able to utilize all data and trends from the outset of the inquiry.
What follows is a table of the biomarkers generated by this method, and a brief description of each.
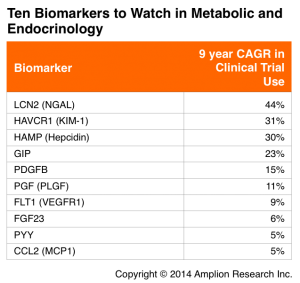
NGAL
NGAL is being used in multiple therapeutic areas (see our list of 10 Biomarkers to Watch in Cardiovascular), but is most commonly used as a marker for kidney injury. It is among the fastest growing biomarkers across all therapeutic areas.
– Existing test providers: none among Labcorp, Quest, ARUP
KIM-1
This membrane receptor is mostly associated with viral infection, but is also a marker of kidney injury.
– Existing test providers: none among Labcorp, Quest, ARUP
Hepcidin
This liver hormone regulates iron metabolism, and is associated with kidney failure among several other diseases in other therapeutic areas. Hepcidin is forecasted to measured in over 25 new trials per year by 2017.
– Existing test providers: none among Labcorp, Quest, ARUP
GIP
This hormone is involved in digestion and fatty acid metabolism, and is associated with obesity in animal studies. Of all the biomarkers on this list, GIP has the highest percentage of publications describing clinical studies.
– Existing test providers: ARUP
PDGFB
This growth factor protein is also associated with oncology, and has strong representation in clinical study publications.
– Existing test providers: Labcorp and Quest
PGF
Another growth factor, PGF seems to be expanding in use beyond cancer.
– Existing test providers: none among Labcorp, Quest, ARUP
FLT1
This tyrosine kinase was first published in a clinical study in 2000, and in recent years there has been a 35% annual increase in the number of clinical studies that include FLT1, so this is clearly a biomarker on the rise.
– Existing test providers: none among Labcorp, Quest, ARUP
FGF23
Another growth factor protein, FGF23 is responsible for phosphate metabolism, and is forecasted to be used on over 15 new trials per year by 2017.
– Existing test providers: Labcorp and Quest
PYY
This peptide has functions related to digestion and absorption, and is associated with both increased and decreased appetite. PYY is forecasted to be included in almost 20 new trials per year by 2017.
– Existing test providers: none among Labcorp, Quest, ARUP
MCP1
This cytokine is associated with diseases in a large number of different therapeutic areas, and in ME is most associated with diabetes.
– Existing test providers: none among Labcorp, Quest, ARUP