We have been discussing for some time in this blog the commonly held belief that biomarker testing is primarily being done using laboratory-developed tests as opposed to FDA-cleared and approved tests. There hasn’t yet been conducted, at least to our knowledge, a comprehensive analysis of growth of LDT developers that provides solid evidence for such an assumption. This post will serve as a first step in providing such an analysis.
For the purposes of this analysis, LDT companies have been separated into two groups: Specialty and Comprehensive. Specialty companies provide a limited number of highly value-added tests (e.g. algorithm-interpreted panels), while Comprehensive companies are national labs that provide a broad range of testing services (molecular testing among them), but for which high volume testing (e.g. clinical chemistry testing) are the bread and butter. Genomic Health is a prototypical Specialty LDT company, and Quest Diagnostics is a prototypical Comprehensive company under this breakdown.
The table below lists prominent publicly-traded Specialty developers of LDTs. Development of specialty LDTs is clearly a growth area, with mean revenue growth of 58% across all companies. By comparison, the average (assumed mean) annual growth rate for all publicly-traded companies in all industries is 7.6% (according to NYU’s Stern Business School published data).

1 Sequenom and Transgenomic both have LDT and RUO divisions; total revenue is reported in this table. LDT revenue for both companies in 2013 was ~50% of total revenue. Regardless, neither company’s revenue multiple was included in the averages for revenue multiples.
There is strong positive correlation (r = 0.7) between market cap and CAGR, so clearly the markets are rewarding growth with high valuations for specialty developers.
The story for the Comprehensive developers of LDTs is a bit different. These are generally much larger companies with much lower average revenue growth. The mean growth rate was just 5% for these companies over the last several years, and they are basically valued right around current revenue levels. An interesting outlier is Bio-Reference Laboratories (BRLI), which experienced double digit CAGR but has a market cap below 2013 revenue. Given the small sample size for Comprehensive developers with publicly accessible financial information, BRLI is definitely a significant contributor to the negative correlation between CAGR and market cap among these companies (r = -0.6).
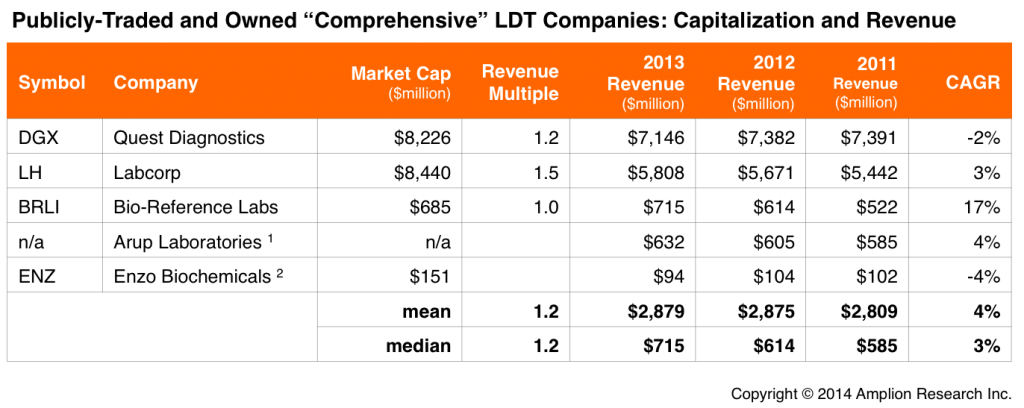
1 Arup Laboratories is owned by the University of Utah. Revenue reported in this table for Arup is actually the total Services line item in the University’s financial statements, which is primarily revenue from Arup operations.
2 Enzo Biochemicals has both RUO and LDT divisions; total revenue is reported here. LDT revenue is >50% of total revenue.
Conclusions and Next Steps
The Specialty developers are growing quickly, and starting to achieve appreciable scale as an industry, with combined revenue of $1.2 billion in 2013. Of course that combined number is just 17% of Quest’s revenue alone, so the large national labs still dominate overall.
It would be interesting to know if there has been any change in molecular testing’s portion of total revenue at Quest and Labcorp over the last five years.
Another next step will be to look at revenue from the many thousands of private CLIA labs nationwide, and lab testing revenue from publicly-traded hospital networks. The former set will be challenging to estimate, but will be essential to understanding growth drivers.
Our hope is that we can develop an LDT Market Index that will take these different growth drivers into consideration, and which will provide an accurate and ongoing understanding of LDT market dynamics.