In a previous post we looked at revenue growth for publicly-traded LDT developers, as the first step in attempting to better understand the market size and segmentation for LDTs. In this post we have pulled together some sales information for publicly-traded developers of FDA-cleared and approved tests for comparison.
For clarity, we refer to diagnostic kits (i.e. FDA-cleared or approved) as “IVDs” or “IVD tests,” and the companies that make them as “IVD companies,” fully acknowledging that many if not most LDTs are in fact in vitro diagnostic tests, and so we are using a common and useful (if not perfectly accurate) industry shorthand for distinguishing between the two test types.
In the prior review of LDT developer revenue we divided the companies into two groups, “Comprehensive” and “Specialty,” as each group of companies is quite different in scale and focus. For the IVD companies we have used the same categories for the same reasons.
An interesting clarification to make at this point is that the large “Comprehensive” LDT companies described in the previous post also tend to provide a lot of testing using FDA tests, and indeed a senior executive at one of the two largest laboratory conglomerates recently told us that the majority of the testing his company performs is done using FDA tests.
A reasonable assumption, however, is that most of this testing using FDA tests is being done for common clinical chemistry measurements, and for biomarker-based tests (our focus) LDTs are represented as a higher percentage. That said, one does need to acknowledge that there is an appreciable amount of “churn” among the larger market participants, with service labs buying FDA tests, the costs for which are then included in the fees charged for the testing service (i.e. test revenue is in essence double-counted in some cases).
The table below lists the 10 largest public IVD companies in terms of their revenue from diagnostics (most of these companies having multiple divisions, diagnostics often not even among the largest). This in itself is an interesting distinction compared to the large lab services companies, which tend to be solely focused on provision of lab services.
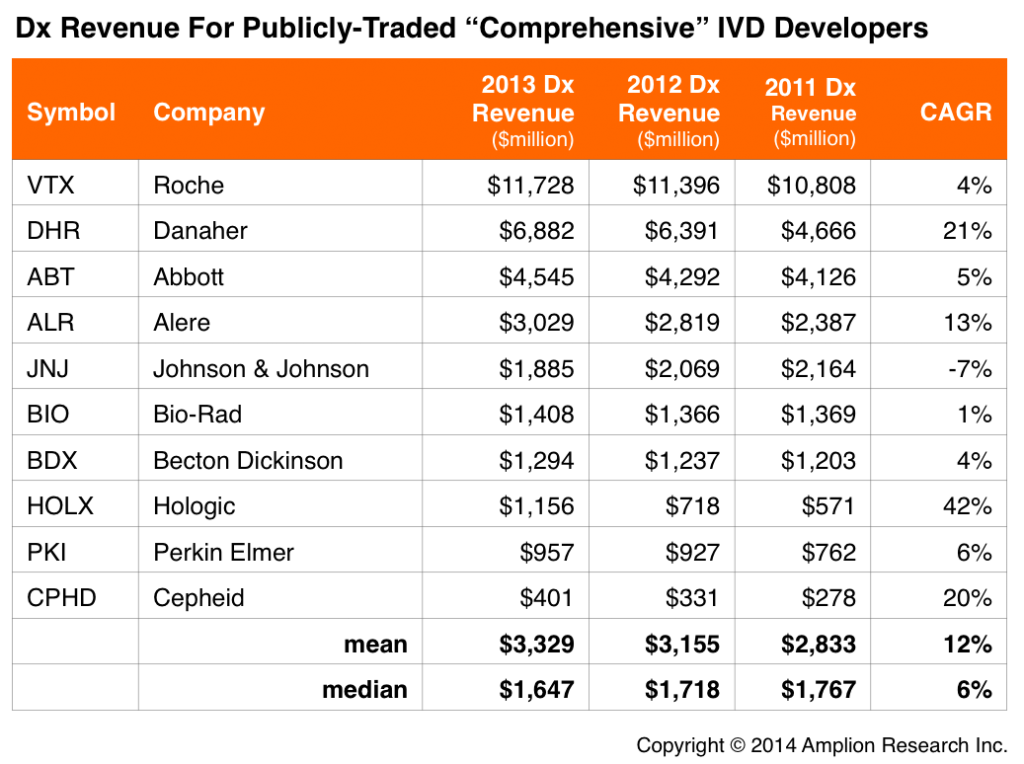
Another interesting takeaway is that diagnostic kit/instrument sales have grown at triple the rate of diagnostic services, with average CAGR of 12% for the IVD developers, compared to 4% for the LDT developers.
When looking at the “Specialty” side of the market, it is clear that there are far fewer IVD developers participating in the public equity markets than there are LDT developers. We were only able to identify four Specialty FDA test developers with revenue over $1 million, and only seven in total. Whether this trend carries over on the private side is unknown.
These few IVD companies are not only smaller in number (compared to eleven Specialty LDT developers in the public markets), but also much smaller than their contemporaries in terms of revenue. Average 2013 revenue among the Specialty IVD companies is just $8 million compared to an average $111 million for the LDT developers.
Growth for the IVD companies is hard to average, since the total sample size is quite small, and because 3 of the 4 companies had less than $5 million in revenue for 2013. Oxford Immunotec has, however, had strong revenue growth over the last five years, and is a worthy example of the potential for rapid growth by IVD companies.
It is interesting to note that whereas CAGR and market cap were strongly positively correlated for the Specialty LDT companies, they are actually strongly negatively correlated for Specialty IVD companies (r = -0.8). Two of the IVD companies (EXACT Sciences and Accelerate Diagnostics) have market caps of ~$1 billion, and well under $5 million in 2013 revenue. The assumption here is that Specialty IVD companies are valued far more for their future potential than are Specialty LDT companies, which are more likely to be valued for their current revenue generating capability.